
Infographics are all the rage these days. One part brain candy and one part eye candy, these shareable data-rich story-tellers are a great compliment to any content marketing mix.
There are many great resources for helping create infographics but I found there were several steps that I needed to take before I could even start.
For this example, I’ll use a recent project we did for a client related to rain barrels.
- Develop your concept. Think about the elements of your idea. What physical objects are involved that can be used within the image? You’ll need images to represent these concepts. In thinking about rain barrels, I came up with the following:
- Rain barrel, rain, water
- Watering can
- House
- Garden, garden hose
- Lawn
You may have a title for your infographic in mind at this point but no worries if not. You’ll uncover that by the end of step 2 or 3. Now ask yourself these questions:
- What kinds of things can you measure?
- What questions do people ask about this subject?
- What’s the story?
- How can you communicate this visually?
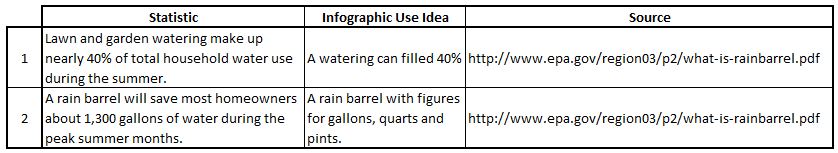
- Do your research. This may be a good task for a researcher (I like elance), but I recommend you do it yourself at least once so you have an appreciation for the process. You’ll likely come up with some ideas for your list in step #1. For example, I found these 2 nuggets on the EPA website after doing a search on rain barrel facts:
a. Lawn and garden watering make up nearly 40% of total household water use during the summer.
b. A rain barrel will save most homeowners about 1,300 gallons of water during the peak summer months.
From these, I added the sun to my list in step 1. Keep a list of your sources for reference later.
Assemble your research in a spreadsheet with columns for the statistic or data point, use idea and source.
- Gather your clip art. Yes, I said clip art. Usually I stay away from these design eyesores but I’m actually glad they are still around for this reason. What you are looking for is license-free solid color silhouette images for the items in your list from step 1. You may also find them within “icon sets” which are easy to manipulate. If you can find the images as part of a theme from the same designer on a site like 123rf.com then purchase what you need there. If you have a good researcher, this may be something you can add to the scope once you have your list of items established.
- Refine and visualize the data points. You’ll likely find some great data but it will be wordy and you need images, not words. Shorten each piece of research as much as possible and try to visualize how this could be displayed within one of the images in step 1. Use a spreadsheet to organize your thoughts. Add a column for documenting these thoughts.
- Assemble your infographic. Some of the resources I mentioned earlier may be useful at this point but you may need to engage a designer that has the full array of tools for pulling all this together, especially if you need a hi-res version of the image. A good graphics design person will be able to take your spreadsheet, color palette (see tip below) and list of items and bring your infographic to life.
Other tips:
- Too much data can be rational justification overload. If you are telling a story, be sure to include emotional elements. Not easy to do but they will be remembered longer than just the data points.
- Try a site like http://www.colorcombos.com to find a color palette for your infographic.
- Struggling for ideas on how to render your information? Do a Google image search for Infographics and get ideas from other concepts.
- If you plan to pay to promote your infographic on a Facebook business page post, it will likely get rejected if it has more than 20% text. Instead, crop out just a part of your infographic that has less than 20% text and use that in the post you want to promote.
Below are some more examples of infographics we have done for another client. Need help with a story you want to tell with an infographic? Contact us here.